EMS Taste and Test – Chilli

Back

The sensory and nutritional results are in and they might surprise you…

June 2, 2021

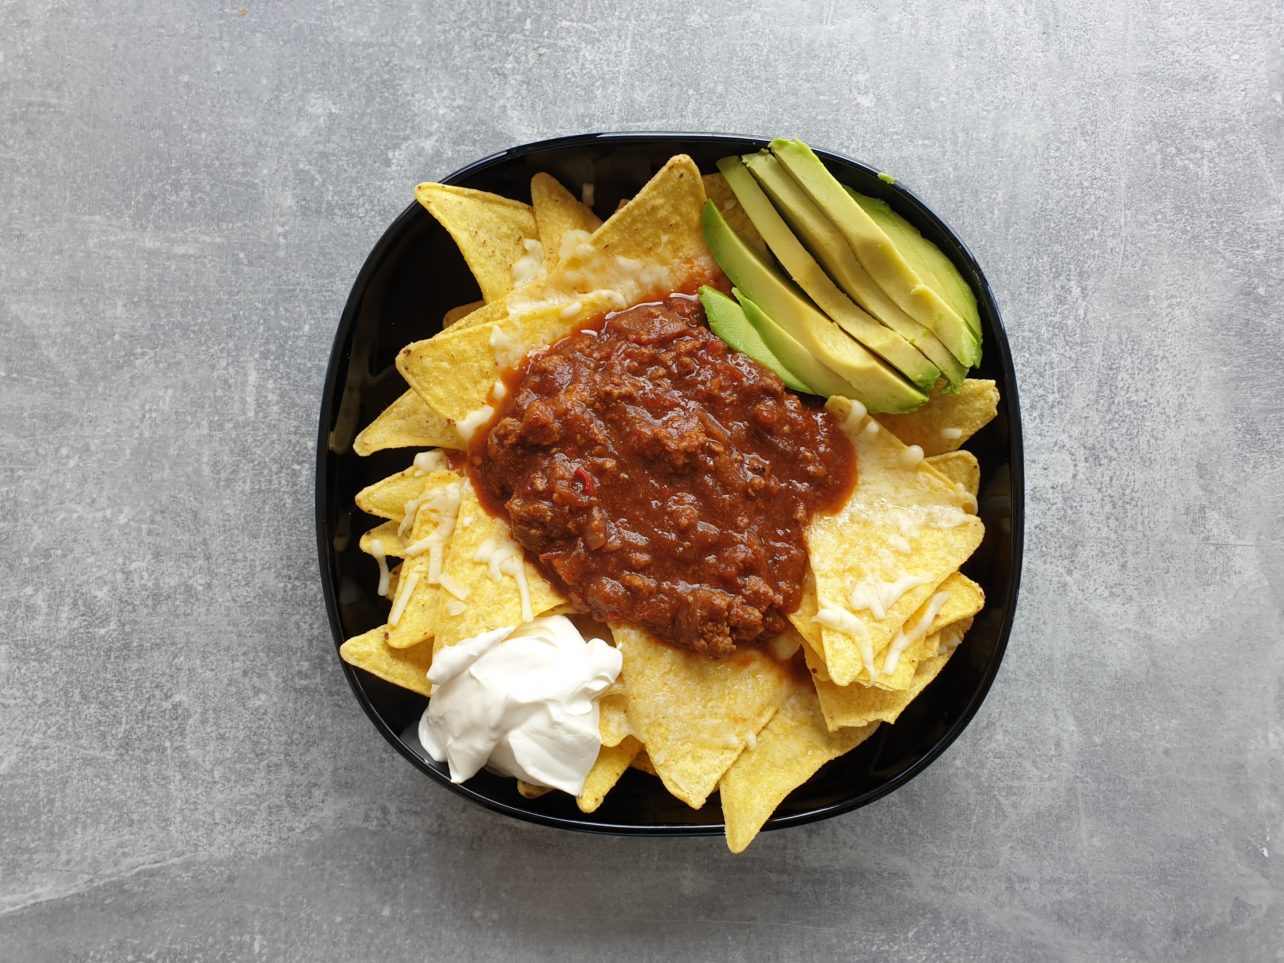
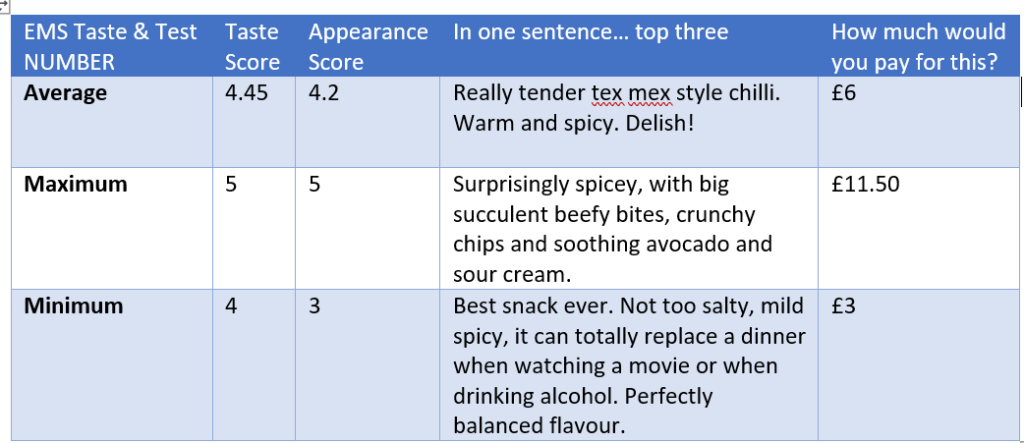
Our second Taste & Test was Transport Manager Alan’s Chilli and the sensory results were encouraging!

Here are some highlights:

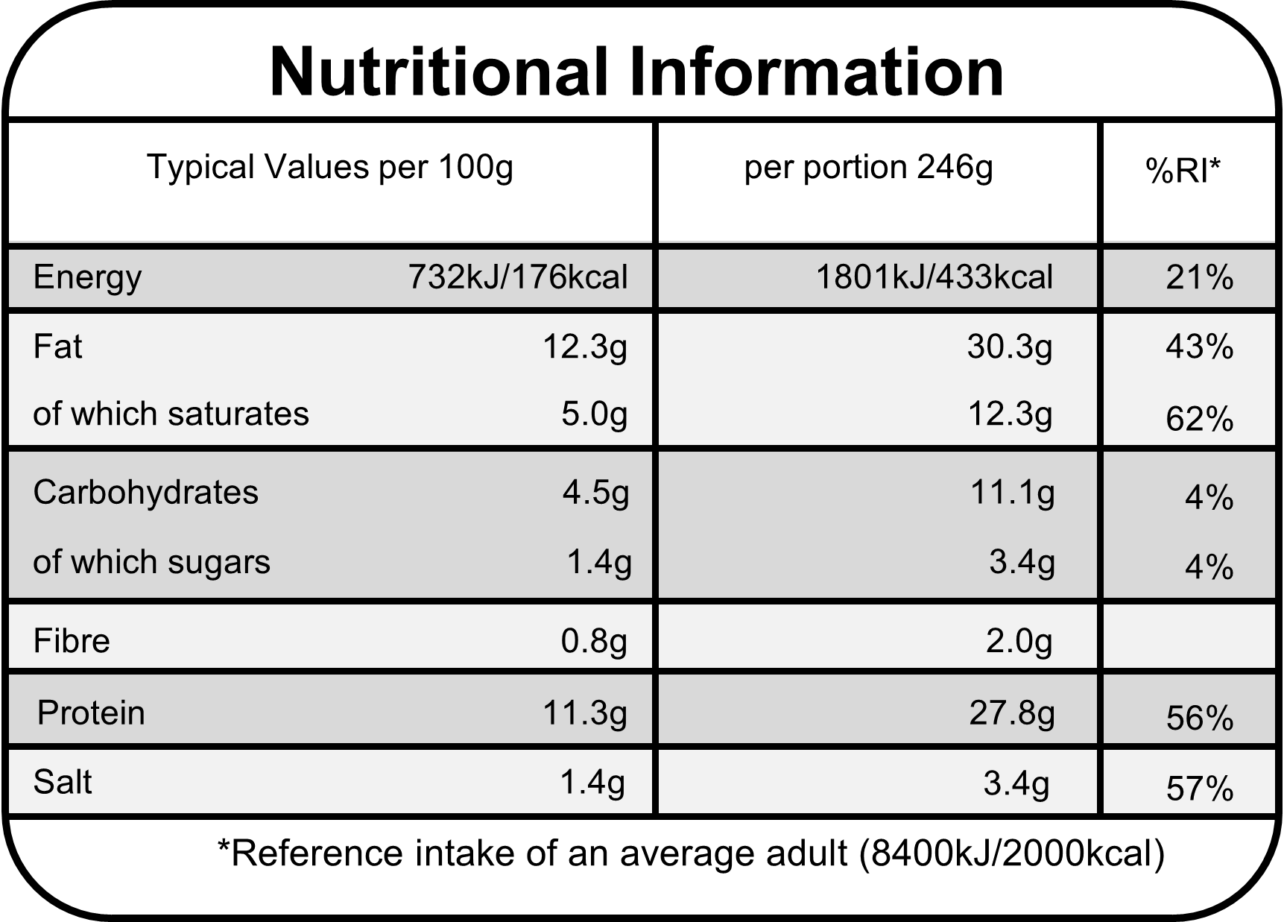
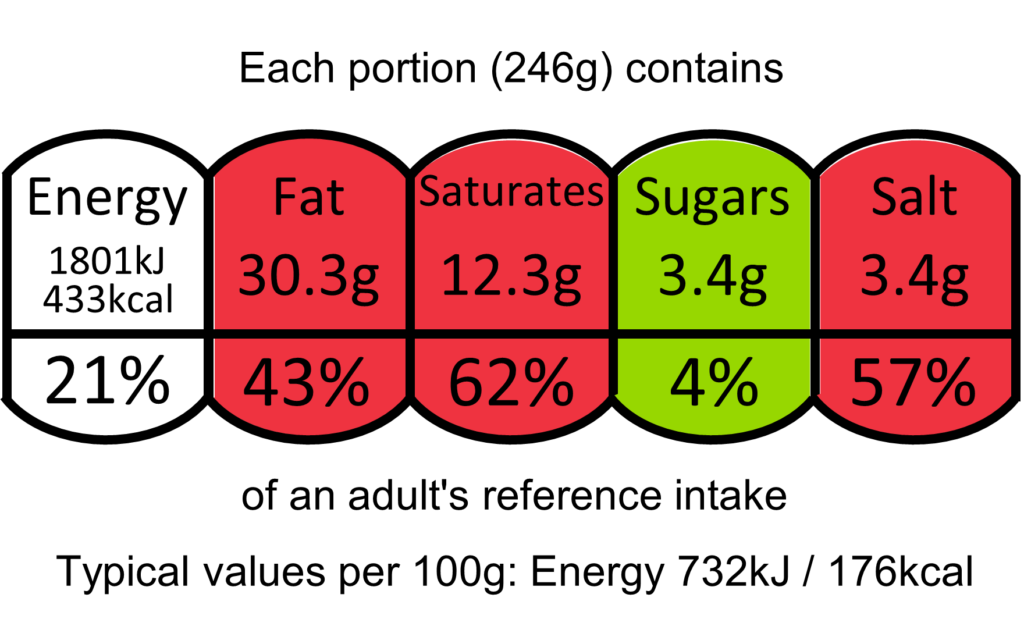
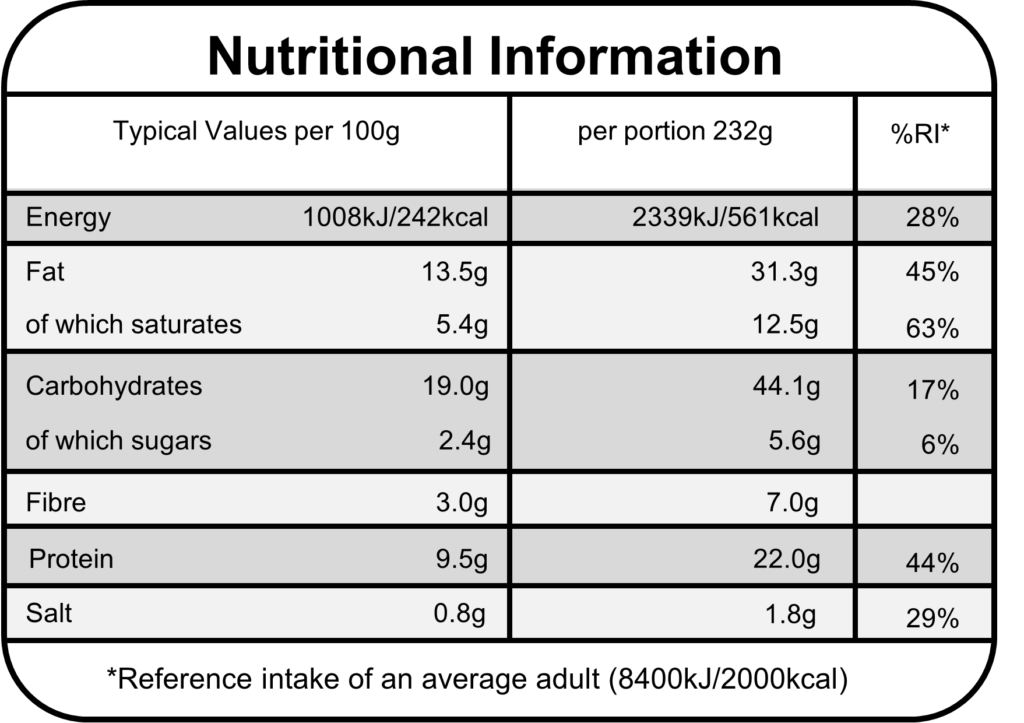
The Nutritional results were, however, a little surprising and show why nutritional analysis can be so important.

The chilli was prepared with the view that it would be a main meal portion (albeit an indulgent one). We’re all guilty of piling our plates a little high when it comes to our favourite comfort foods, however the nutritional results came back with one mission: to shame us into sharing portions!

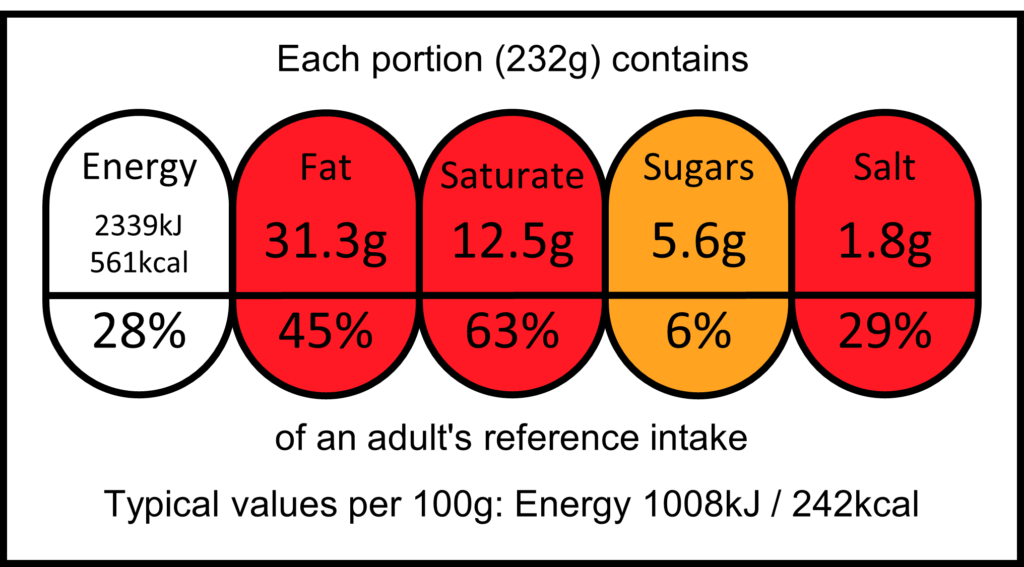
In all seriousness, even if this dish was sold as a starter for 2, it would still be very unhealthy. Tasty, comforting and everything you might want after a tough week, but is it worth it?

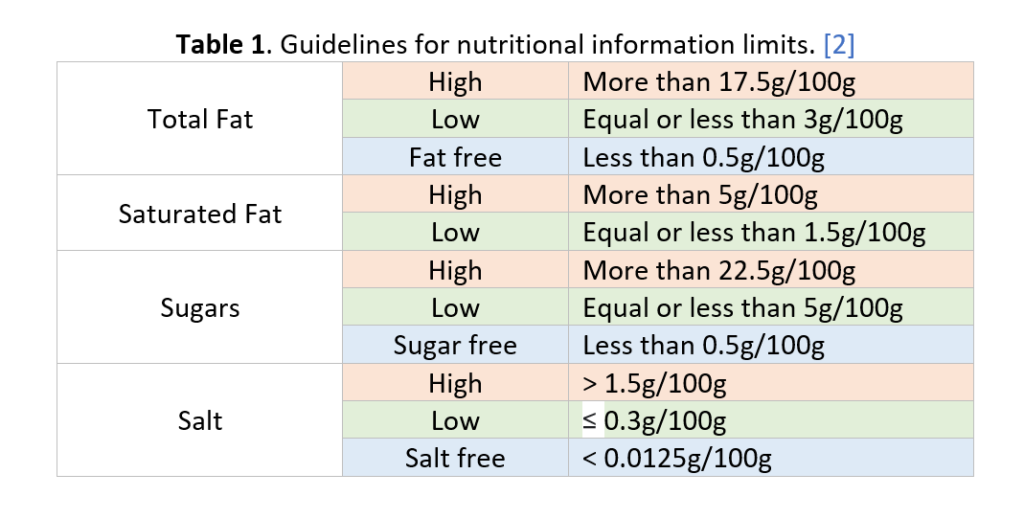
In the chilli’s defence there are ways to make it healthier, swap out the cheese and nachos for boiled rice, maybe a quarter an avocado instead of half. Also, unsure what % fat that Alan used but you can get less than 5% lean steak mince. This would all help in making a tasty dish a little less likely to kill us all!

The above would all be ways of making this recipe healthier for at home consumption. However, calories may not be as concerning when dining out for a special meal as you would not be eating this indulgently every day.

It is still valuable to customers to be aware of the contents of their food, if someone has high blood pressure, it would be important for them to try to avoid food high in salt. For most people though the odd cheeky high fat/salt meal would not be the worst thing in the world but with the calories on display they can make an informed choice and decide for themselves if this were what they would like to eat. This chilli was worth the calories. 

In the restaurant industry, food portions would have been determined by price of ingredients, staff wages, electricity, rent of property etc. In many eateries, certain dishes can be ordered as a main portion or a starter. This is an option that has been displayed here, with the chilli initially being designed as a main but has been finally presented as a sharing starter for two. Halving the calories per portion but not skimping on taste!

EMS Taste & Test – Buffalo Wings Nutritional Results

Back

The Nutritional Results for our Buffalo Wings

May 21, 2021

The results are in!

Our very first EMS Taste & Test was a hit – and we’ve already had our second (but more on that to follow shortly)! The sensory test for the Buffalo Wings was a great place to start; it gives the food provider (in this case, the MDs husband, Stuart) a better idea of a flavour profile, appearance feedback and an approximate price that tasters are willing to pay for the dish. All of this information can used to help product placement and provide verified information to customers on flavour and the tasting experience. We currently offer reports of this nature to major retailers such as Lidl, who use our reports to ensure products sold in their stores are as the producer intended and meet all mandatory labelling requirements.

Our Taste & Test would not be complete without a full run-down of the nutritional content. On the front of food products, you buy in a supermarket, you will see a ‘traffic light’ breakdown of nutritional information. This is a legal requirement.

Our Buffalo Wing results are below:

Buffalo wings may not be the healthiest option on the menu and if you are trying to limit your calorie intake or avoid saturated fats or salt, maybe keep them as a special treat! However, they are very high in protein and low in sugar, so if you’re looking to bulk up a bit, hit the gym and want a bite full of protein, these maybe the ideal post work out snack!

Fun fact! Why are Buffalo Wings called buffalo wings when there is no buffalo meat to be found?

It is generally agreed by historians that Buffalo wings were invented by an eating establishment called Anchor Bar in Buffalo NY USA —or rather, their owner Teressa Bellissimo did — the rest of the origin varies but a popular story is after being accidentally shipped wings instead of other chicken parts and, as such, the now famous snack was invented out of a desire not to waste perfectly good poultry. (ref: https://www.tasteofhome.com ; https://en.wikipedia.org/wiki/Buffalo_wing)

If you’re interested in having a go at making these sumptuous buffalo wings at home, click here, put ‘Buffalo Wings’ in the subject line and we will send you the recipe!

Comparing Fat Testing Methods of Milk and Milk Products

Back

If you’ve ever wondered what methods we use to test for fats in milk and milk products, this post is for you!

February 16, 2021

By Jennifer Newton

There are so many methods to choose from when testing the fat content of milk and milk products. This might be because historically, many unscrupulous farmers watered down their milk and scooped off cream to increase their volumes, so they could make more money whilst the consumer got short-changed. Nowadays, most commercial transactions of selling milk are based on the fat content (who wants to be paying for water?). So, faster and cheaper testing methods are constantly being developed to determine the actual fat content of milk.


The question remains; “what is the best test method for fat content in milk and milk products?” The answer depends on what information you require for your decision. It can be confusing, but first determine your goal. Are you monitoring your herd’s average production? Are you selling an average season production, negotiating a crucial delivery or exporting to an important market?

If it is one of the latter, you want the test method to be recognised internationally and you want a laboratory with ISO 17025 accreditation to be doing your analysis. Those laboratories will have had their testing audited and their results assessed, and they will be using internationally recognised methods.


Whilst the most common laboratory-based method in use today are the Gerber Method in Europe and the Babcock Method in the US, there is agreement amongst experts that the ultimate precision method for determination of milk fat content is the Röse-Gottlieb (Bogomolov et al., 2017). The Babcock and Gerber method are very similar methodologies, and it has been found that the Gerber method measures consistently but only slightly higher than the Röse-Gottlieb method (Crocker et al., 2009).


If you need an accredited test for fat content in milk, cream or ice cream or would like some more information feel free to contact us.

Nutrition Facts: The Science Behind the Label

Back

All about nutritional values and how they are produced.

February 12, 2021

By Francisca Navarro Fuentes

Have you ever read the nutrition facts on your Friday nights double pepperoni frozen pizza? Did you ever wonder what those values mean, or think about how they are produced? Feed your curiosity with this post and find out about the science behind the label!

Nutrition facts are a powerful tool to help you understand the composition of a product, so that the consumer of the product is informed. Nowadays, the variety of products to choose from is endless, but knowing what is in your food can help you to pick what to buy.

By law, it is mandatory that nutrition facts are included in labels. This is controlled by Regulation (EU) No 1169/2011 [1] on the provision of food information to consumers. Therefore, nutrition declaration must include energy (KJ/Kcal), total fat and saturated fat (g), carbohydrates and sugars (g), proteins (g) and salt (g). Besides, it is optional to include values such as mono-unsaturates and polyunsaturates, polyols, starch, fibers and vitamins or minerals. The values are reported per 100g or 100mL of product, and often per portion too.

But do all products have to have a nutrition label? It may surprise you to learn that the answer is: no. There are products  exempt from this rule, such as waters, spices, salt, sweeteners, tea, food additives, gelatine, yeast and chewing gums, among others.

Most people don’t pay attention to the nutritional information and one of the reasons could be a lack of knowledge on how to interpret them. In order to help the consumer, the NHS has published a list of guidelines, summarized in Table 1.

So how are nutritional values produced?

Nutritional values are produced in analytical chemistry laboratories. A representative portion of the product arrives to the laboratory, this is then blended and homogenized into a paste (like your morning vegetable smoothy, ew!). This paste is stored in an airtight bag, ready for analysis.

Chromatography, flame photometry, spectrophotometry, high temperatures (up to 600 ºC!) and high pressures are techniques and conditions used to determine nutritional values. As you would imagine, in order to provide this information, trained chemistry analysts are required. I know, these techniques sound scary but, believe me, chemists love them! Although these machines are subject to break downs, chemists like me thrive on a broken machine’s challenge.

Now, how can you (or I), as a consumer, trust the values in the nutrition facts table? For that, a governmental body, known as United Kingdom Accreditation Service (UKAS), assesses and accredits analytical chemistry laboratories ensuring that the values obtained in laboratory A would be the same as the ones in laboratory B across the UK.

In conclusion, labels are educational as it helps to understand calories and nutrients. They regulated by Regulation (EU) No 1169/2011 and the values are generated in UKAS accredited analytical chemistry laboratories, ensuring the customer rights and accuracy of the data.

References

[1] EUR-Lex Website: https://eur-lex.europa.eu/legal-content/EN/TXT/?uri=CELEX:02011R1169-20180101 Last visited 6/2/21

[2] NHS Website: https://www.nhs.uk/live-well/eat-well/how-to-read-food-labels/#:~:text=Nutrition%20labels%20are%20often%20displayed,certain%20nutrients%2C%20such%20as%20fibre. Last visited 6/2/21